THE UNIVERSITY PROFILE
Some percentages or figures in this section do not add up to 100% or total owing to rounding.
Students*
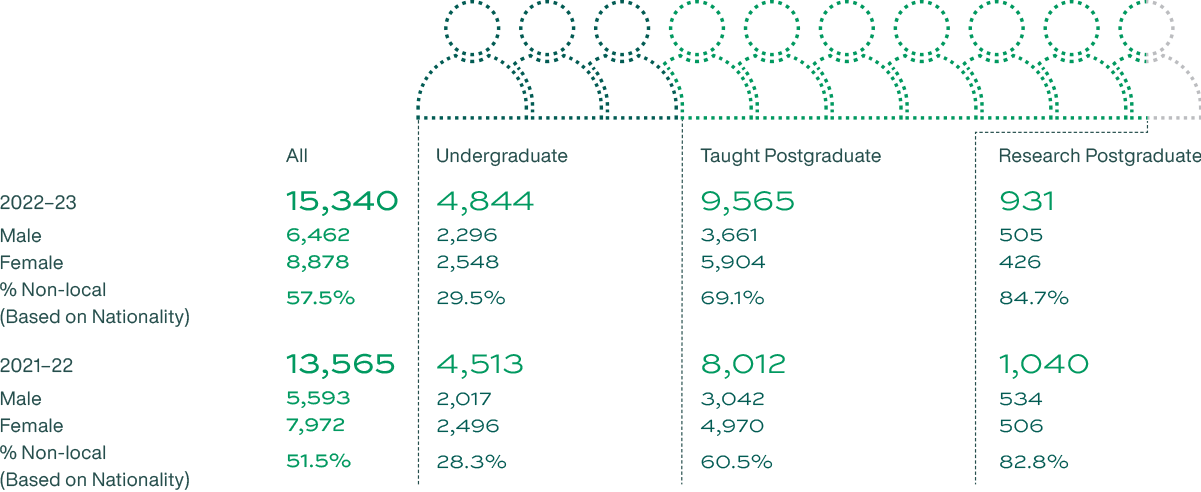
STUDENT ADMISSION
New intakes
ENROLMENT OF STUDENTS ON ALL PROGRAMMES
| Faculty | Undergraduate | Taught Postgraduate | Research Postgraduate | All Levels | ||||
|---|---|---|---|---|---|---|---|---|
| 2022–23 | 2021–22 | 2022–23 | 2021–22 | 2022–23 | 2021–22 | 2022–23 | 2021–22 | |
| Architecture | 730 | 721 | 768 | 748 | 163 | 136 | 1,661 | 1,605 |
| Arts | 1,871 | 1,859 | 1,076 | 886 | 225 | 236 | 3,172 | 2,981 |
| Business and Economics | 3,076 | 2,956 | 4,562 | 3,598 | 179 | 163 | 7,817 | 6,717 |
| Dentistry | 466 | 452 | 83 | 87 | 120 | 96 | 669 | 635 |
| Education | 939 | 975 | 1,413 | 1,435 | 248 | 243 | 2,600 | 2,653 |
| Engineering | 2,558 | 2,437 | 2,405 | 1,899 | 933 | 843 | 5,896 | 5,179 |
| Law | 569 | 552 | 1,145 | 1,149 | 96 | 85 | 1,810 | 1,786 |
| Medicine | 3,485 | 3,353 | 937 | 878 | 908 | 866 | 5,330 | 5,097 |
| Science | 2,626 | 2,532 | 708 | 549 | 684 | 649 | 4,018 | 3,730 |
| Social Sciences | 1,708 | 1,680 | 1,445 | 1,393 | 261 | 246 | 3,414 | 3,319 |
| All Faculties | 18,028 | 17,517 | 14,542 | 12,622 | 3,817 | 3,563 | 36,387 | 33,702 |
| In % Distribution | 49.5% | 52.0% | 40.0% | 37.5% | 10.5% | 10.6% | 100% | 100% |
ENROLMENT OF NON-LOCAL STUDENTS (BASED ON NATIONALITY)
| Region | Undergraduate | Taught Postgraduate | Research Postgraduate | All Levels | ||||
|---|---|---|---|---|---|---|---|---|
| 2022–23 | 2021–22 | 2022–23 | 2021–22 | 2022–23 | 2021–22 | 2022–23 | 2021–22 | |
| Headcount | ||||||||
| Mainland China | 2,887 | 2,487 | 7,769 | 5,462 | 2,749 | 2,465 | 13,405 | 10,414 |
| Other Asian Countries | 1,522 | 1,481 | 316 | 320 | 212 | 210 | 2,050 | 2,011 |
| Australia and New Zealand | 64 | 65 | 61 | 66 | 14 | 14 | 139 | 145 |
| European Countries | 207 | 217 | 189 | 251 | 88 | 93 | 484 | 561 |
| North American Countries | 134 | 138 | 158 | 188 | 54 | 61 | 346 | 387 |
| Others e.g. Central and South America, African Countries |
30 | 20 | 39 | 16 | 32 | 30 | 101 | 66 |
| All Regions | 4,844 | 4,408 | 8,532 | 6,303 | 3,149 | 2,873 | 16,525 | 13,584 |
| % | ||||||||
| Mainland China | 59.6% | 56.4% | 91.1% | 86.7% | 87.3% | 85.8% | 81.1% | 76.7% |
| Other Asian Countries | 31.4% | 33.6% | 3.7% | 5.1% | 6.7% | 7.3% | 12.4% | 14.8% |
| Australia and New Zealand | 1.3% | 1.5% | 0.7% | 1.0% | 0.4% | 0.5% | 0.8% | 1.1% |
| European Countries | 4.3% | 4.9% | 2.2% | 4.0% | 2.8% | 3.2% | 2.9% | 4.1% |
| North American Countries | 2.8% | 3.1% | 1.9% | 3.0% | 1.7% | 2.1% | 2.1% | 2.8% |
| Others e.g. Central and South America, African Countries |
0.6% | 0.5% | 0.5% | 0.3% | 1.0% | 1.0% | 0.6% | 0.5% |
| All Regions | 100% | 100% | 100% | 100% | 100% | 100% | 100% | 100% |
*All student statistics shown above include students on UGC-funded, self-funded as well as outreach programmes. Exchange-in and visiting students are excluded.
HKU SCHOOL OF PROFESSIONAL AND CONTINUING EDUCATION (HKU SPACE)
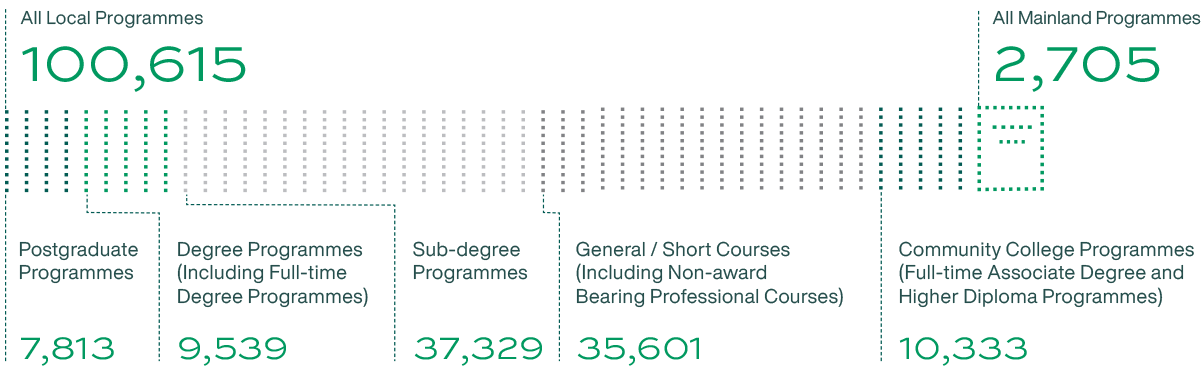
ENROLMENT OF STUDENTS IN PROGRAMMES RUN BY HKU SPACE IN 2022–23
GRADUATES*
GRADUATES OF ALL PROGRAMMES

DISTRIBUTION OF NON-LOCAL GRADUATES (BASED ON NATIONALITY)
| Region | Undergraduate | Taught Postgraduate | Research Postgraduate | All Levels | ||||
|---|---|---|---|---|---|---|---|---|
| 2022–23 | 2021–22 | 2022–23 | 2021–22 | 2022–23 | 2021–22 | 2022–23 | 2021–22 | |
| Headcount | ||||||||
| Mainland China | 422 | 483 | 5,318 | 3,846 | 453 | 418 | 6,193 | 4,747 |
| Other Asian Countries | 356 | 341 | 189 | 194 | 37 | 40 | 582 | 575 |
| Australia and New Zealand | 12 | 17 | 39 | 24 | 3 | 1 | 54 | 42 |
| European Countries | 65 | 57 | 107 | 131 | 20 | 21 | 192 | 209 |
| North American Countries | 29 | 38 | 78 | 109 | 9 | 13 | 116 | 160 |
| Others e.g. Central and South America, African Countries |
1 | 5 | 9 | 10 | 8 | 6 | 18 | 21 |
| All Regions | 885 | 941 | 5,740 | 4,314 | 530 | 499 | 7,155 | 5,754 |
| % | ||||||||
| Mainland China | 47.7% | 51.3% | 92.6% | 89.2% | 85.5% | 83.8% | 86.6% | 82.5% |
| Other Asian Countries | 40.2% | 36.2% | 3.3% | 4.5% | 7.0% | 8.0% | 8.1% | 10.0% |
| Australia and New Zealand | 1.4% | 1.8% | 0.7% | 0.6% | 0.6% | 0.2% | 0.8% | 0.7% |
| European Countries | 7.3% | 6.1% | 1.9% | 3.0% | 3.8% | 4.2% | 2.7% | 3.6% |
| North American Countries | 3.3% | 4.0% | 1.4% | 2.5% | 1.7% | 2.6% | 1.6% | 2.8% |
| Others e.g. Central and South America, African Countries |
0.1% | 0.5% | 0.2% | 0.2% | 1.5% | 1.2% | 0.3% | 0.4% |
| All Regions | 100% | 100% | 100% | 100% | 100% | 100% | 100% | 100% |
* All graduate statistics shown above include graduates on UGC-funded, self-funded as well as outreach programmes.
NUMBER OF PROGRAMMES#
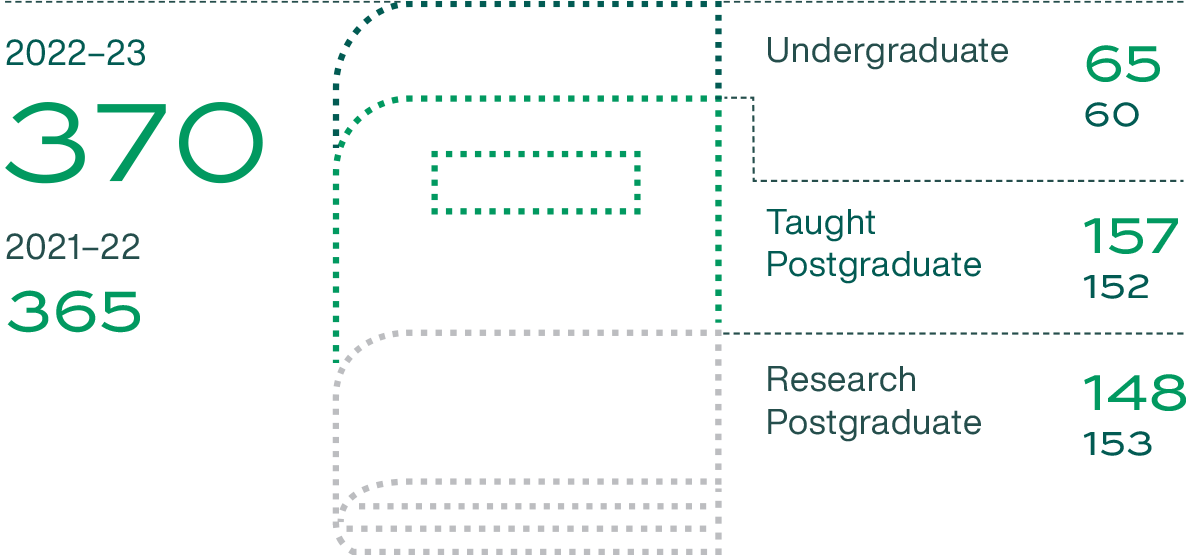
# The number of programmes listed include where applicable, programmes offered in the full-time and part-time modes which are counted as separate programmes. The counting of research postgraduate programmes is based on the academic departments with research postgraduate students enrolled in the year under reference.
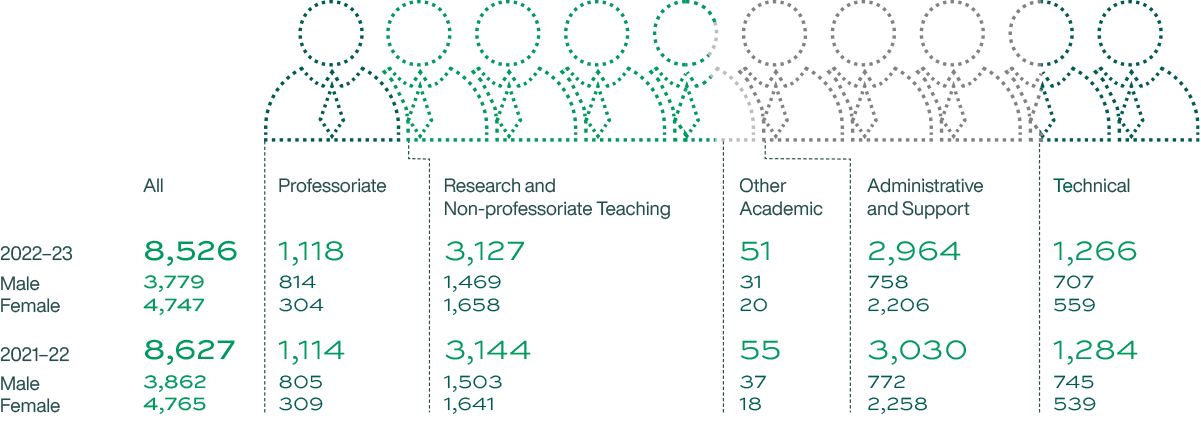
STAFF+
NUMBER OF STAFF IN HEADCOUNT
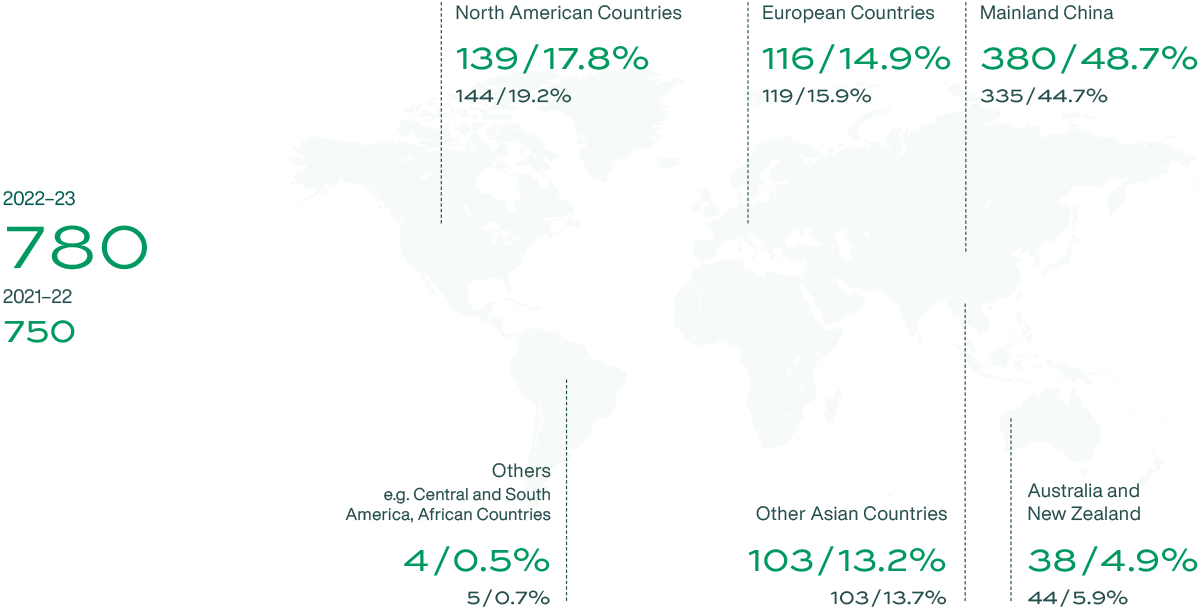
DISTRIBUTION OF NON-LOCAL PROFESSORIATE STAFF (BASED ON NATIONALITY)
+ All staff statistics shown above include UGC-funded and self-funded staff, honorary and visiting staff are excluded.
RESEARCH
RESEARCH FUNDING
HK$ (in million)
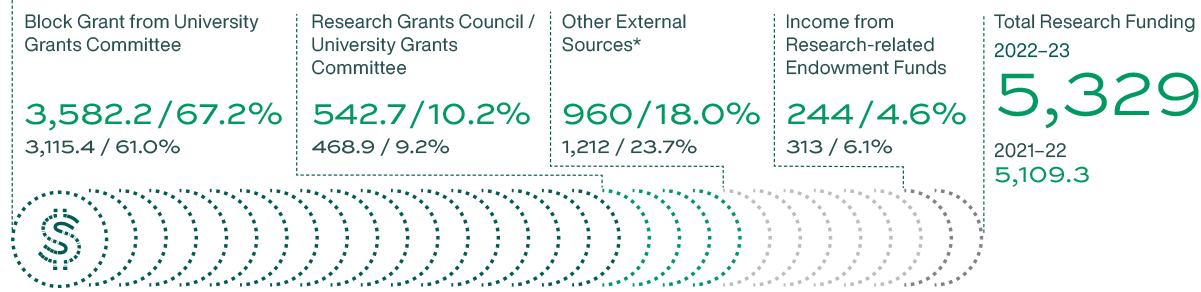
* Includes the following fund sources: government, private, industry and HKU Foundation.
RESEARCH PROJECTS
Ongoing and new
| Research Grants Projects | Research Contract Projects | All | |||||
|---|---|---|---|---|---|---|---|
| No. of Projects | HK$ M | No. of Projects | HK$ M | No. of Projects | HK$ M | ||
| Biology and Medicine | 2022-23 2021-22 |
4,488 4,122 |
8,750.4 8,129.9 |
423 381 |
1,020.9 1,222.6 |
4,911 4,502 |
9,771.2 9,352.5 |
| Engineering | 2022-23 2021-22 |
956 816 |
1,470.1 1,201.7 |
186 147 |
282 216.7 |
1,142 963 |
1,752.1 1,418.4 |
| Humanities, Social Sciences and Business Studies | 2022-23 2021-22 |
1,704 1,546 |
2,355.5 2,191.2 |
167 156 |
218.4 326.6 |
1,871 1,702 |
2,636.9 2,517.8 |
| Physical Sciences | 2022-23 2021-22 |
689 637 |
959.6 806.5 |
43 38 |
94.6 87.8 |
732 675 |
1,054.2 894.4 |
| All Disciplines | 2022-23 2021-22 |
7,837 7,121 |
13,535.6 12,329.3 |
819 721 |
1,678.9 1,853.7 |
8,656 7,842 |
15,214.5 14,183 |
CUMULATIVE NUMBER OF PATENTS GRANTED
Since 1998 and up to June 2023

# Multiple types refer to patent granted which covers more than one of those types specified.
LIBRARY RESOURCES
NUMBER OF BOUND VOLUMES IN MAIN AND SPECIALIST LIBRARIES 2022–23

E-RESOURCES 2022–23

TOTAL NUMBER OF REGISTERED LIBRARY USERS 2022–23
147,776
STUDENT LEARNING SUPPORT RESOURCES / SERVICES 2022–23

Total Library
Seats
3,006

Group Discussion
Rooms
59

24 Hours Library
Seats for All
78

Computer
Workstations
422

Wireless Network
Access Points
193

Postgraduate
Library Workshops
68

Single Study Carrels /
Rooms for
Postgraduate Students
Main Library
60
Law Library
38
Medical Library
30

Information and
Referral Service
57,798
Reference Transactions
COMPUTING AND NETWORK RESOURCES
COMPUTING AND NETWORK RESOURCES
As of June 2023

Wired Network
Access Points
50,216

Wireless Network
Access Points
10,241

Total Bandwidth for Direct Connection to the Internet and Research / Education Networks
42
Gbps

Aggregated Central Computing Power for Teaching and Research Purposes (Theoretical Peak Computing Speed)
1,099.4
TFLOPS
GIVING TO HKU
DONATION FACTS 2022-23
Total Number
of Gifts Received
5,016
Total Amount
of Donations
HK$702M
Total Number
of Donors
3,686
Number of First-time
Donors
2,364
Ratio of Alumni vs Non-alumni Donors
82:18
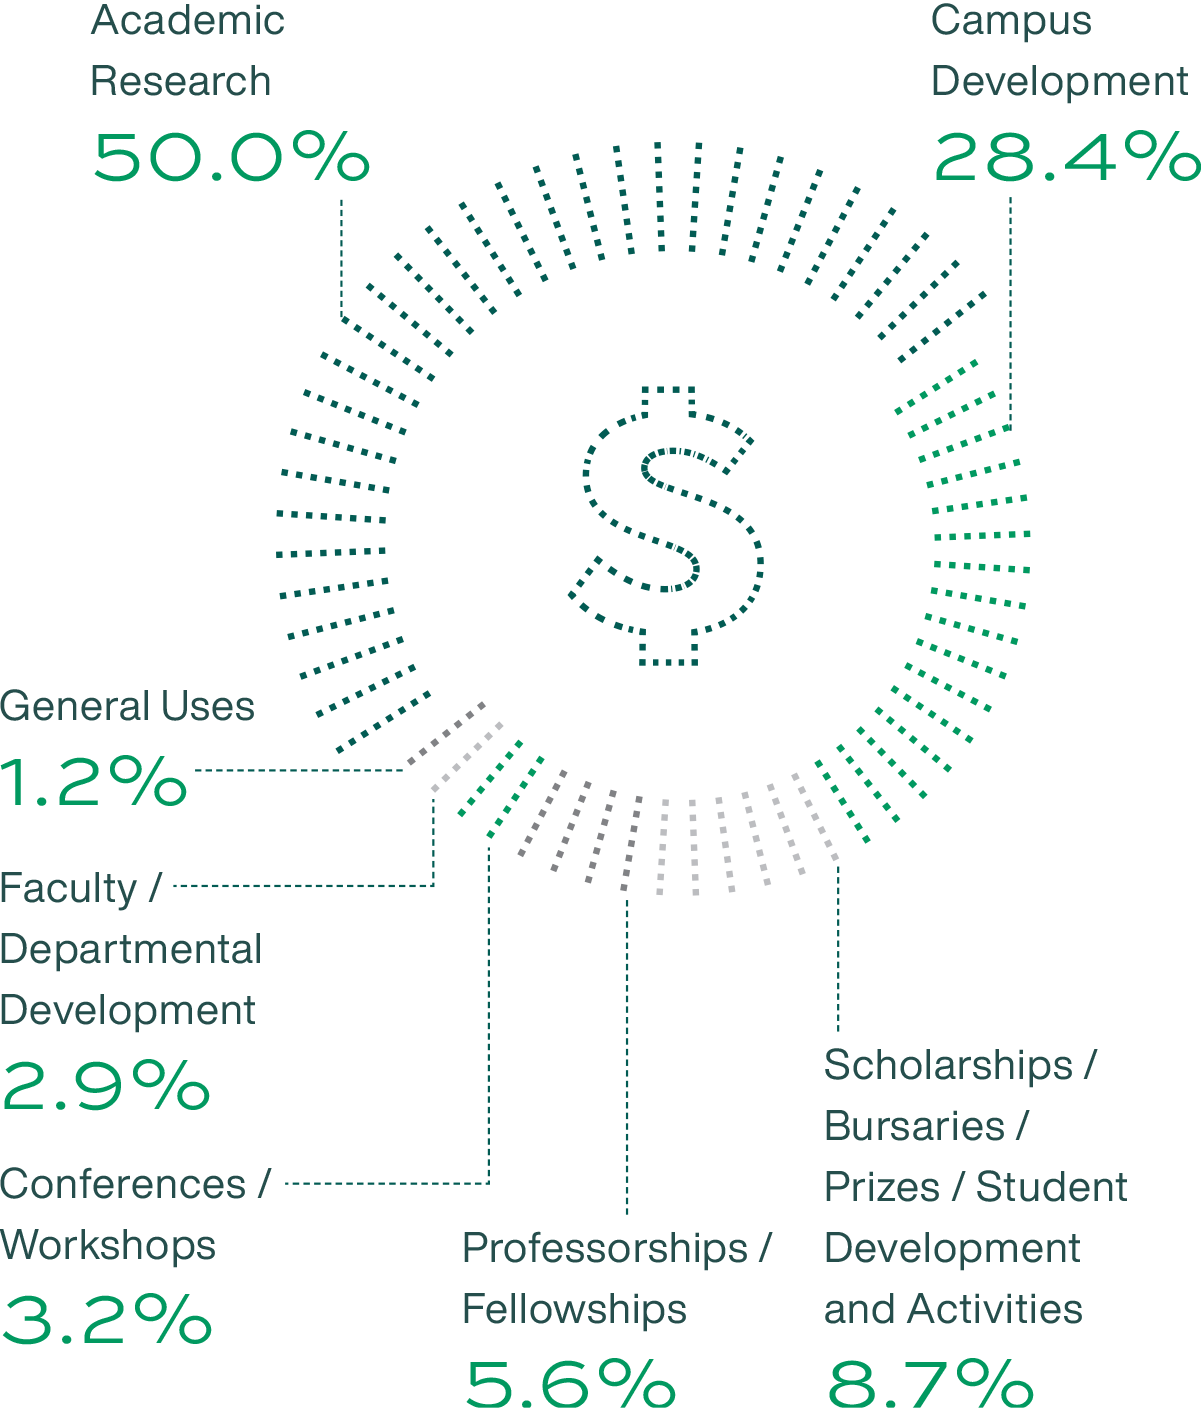
DISTRIBUTION OF DONATIONS 2022–23
FINANCE
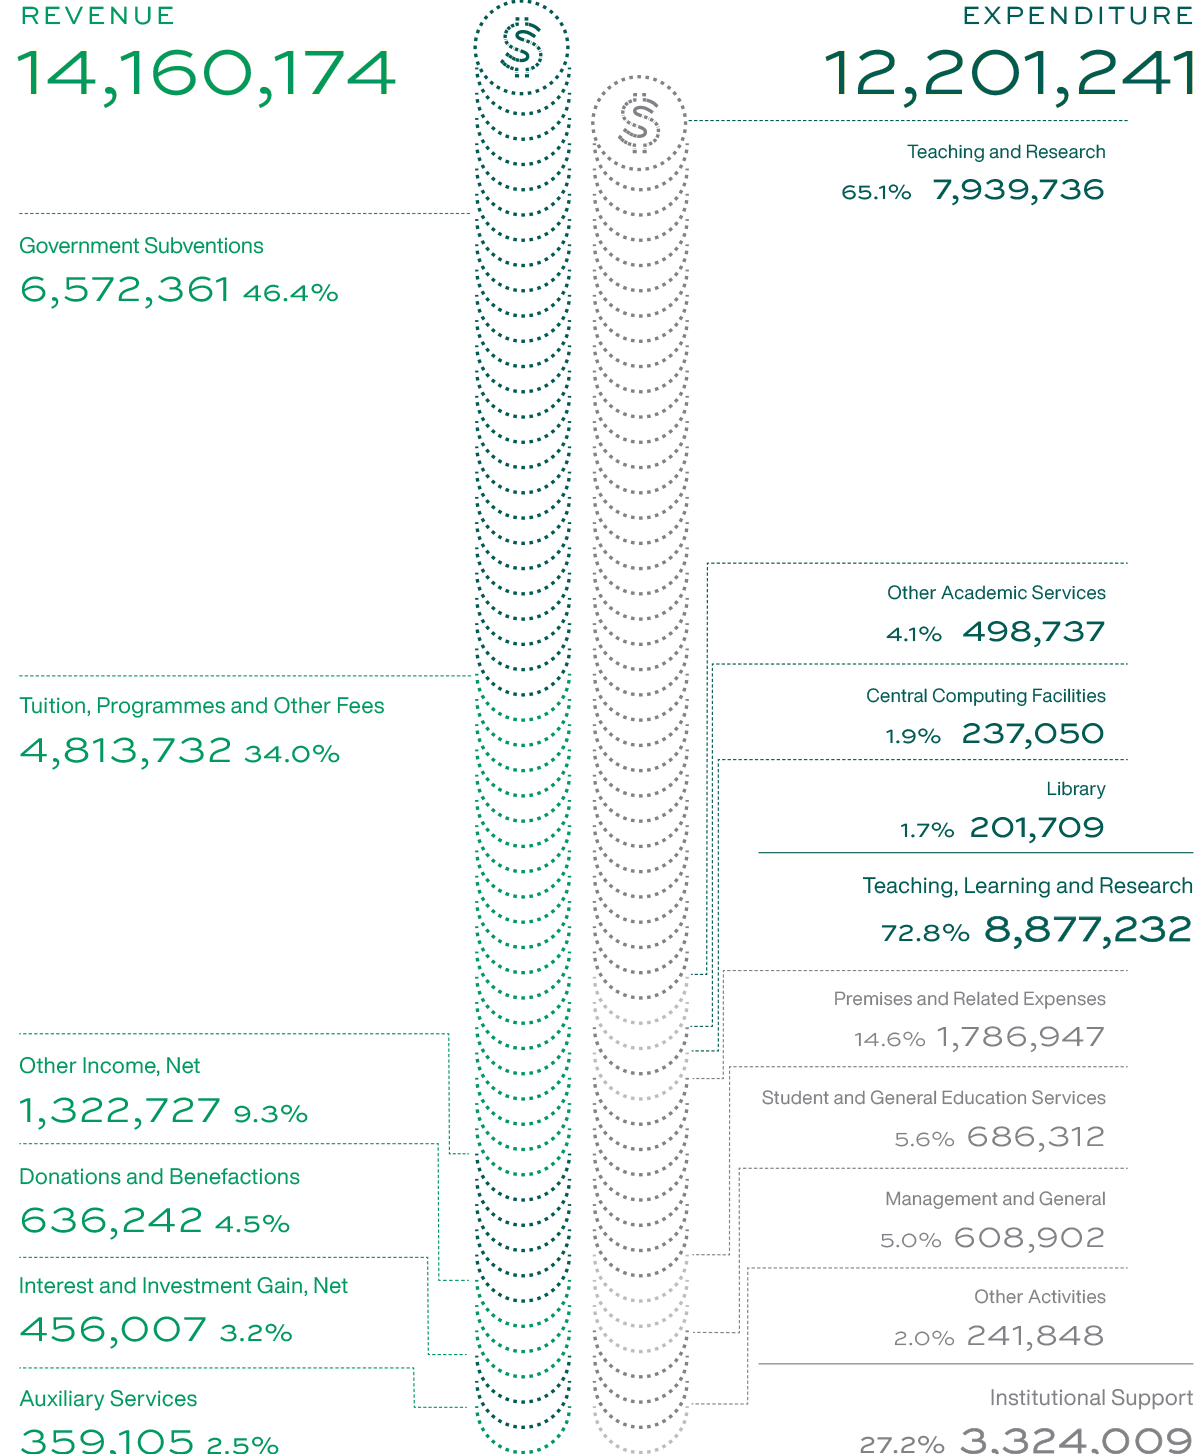
AN ANALYSIS OF CONSOLIDATED INCOME AND EXPENDITURE
For the year ended June 30, 2023
In thousands of Hong Kong dollars
SPACE
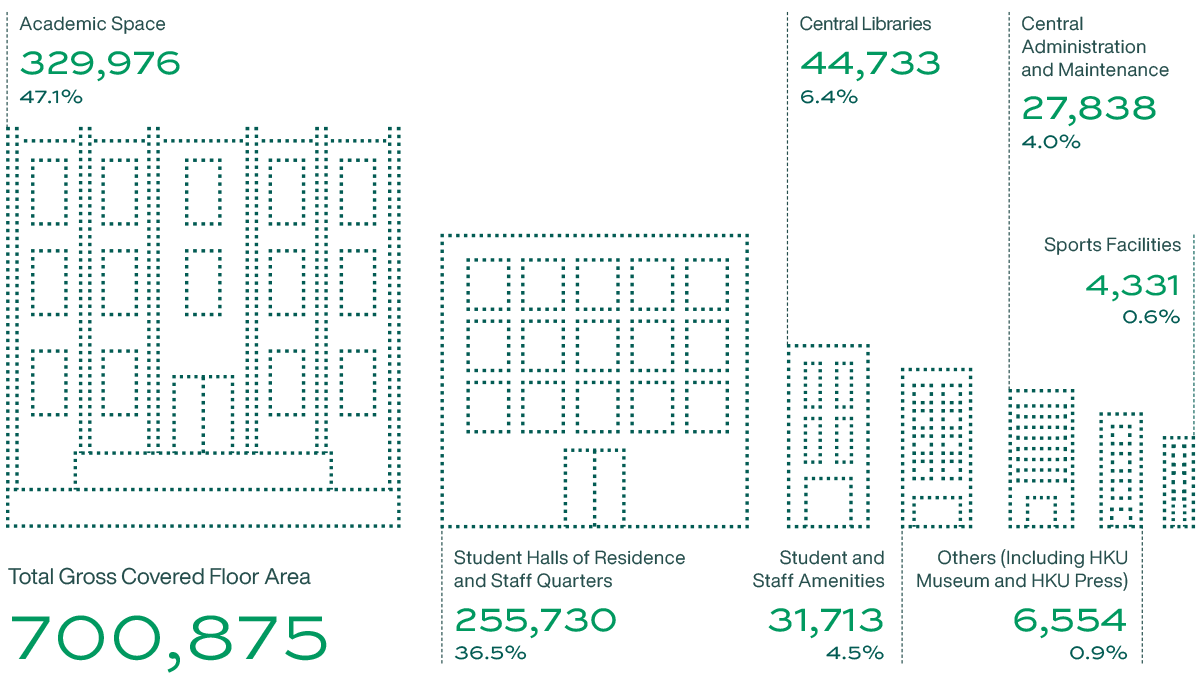
DISTRIBUTION OF SPACE BY CATEGORIES BASED ON TOTAL GROSS COVERED FLOOR AREA
As of June 2023
In sq.m.
HKU SPACE GROSS COVERED FLOOR AREA
As of June 2023
48,561 sq.m.
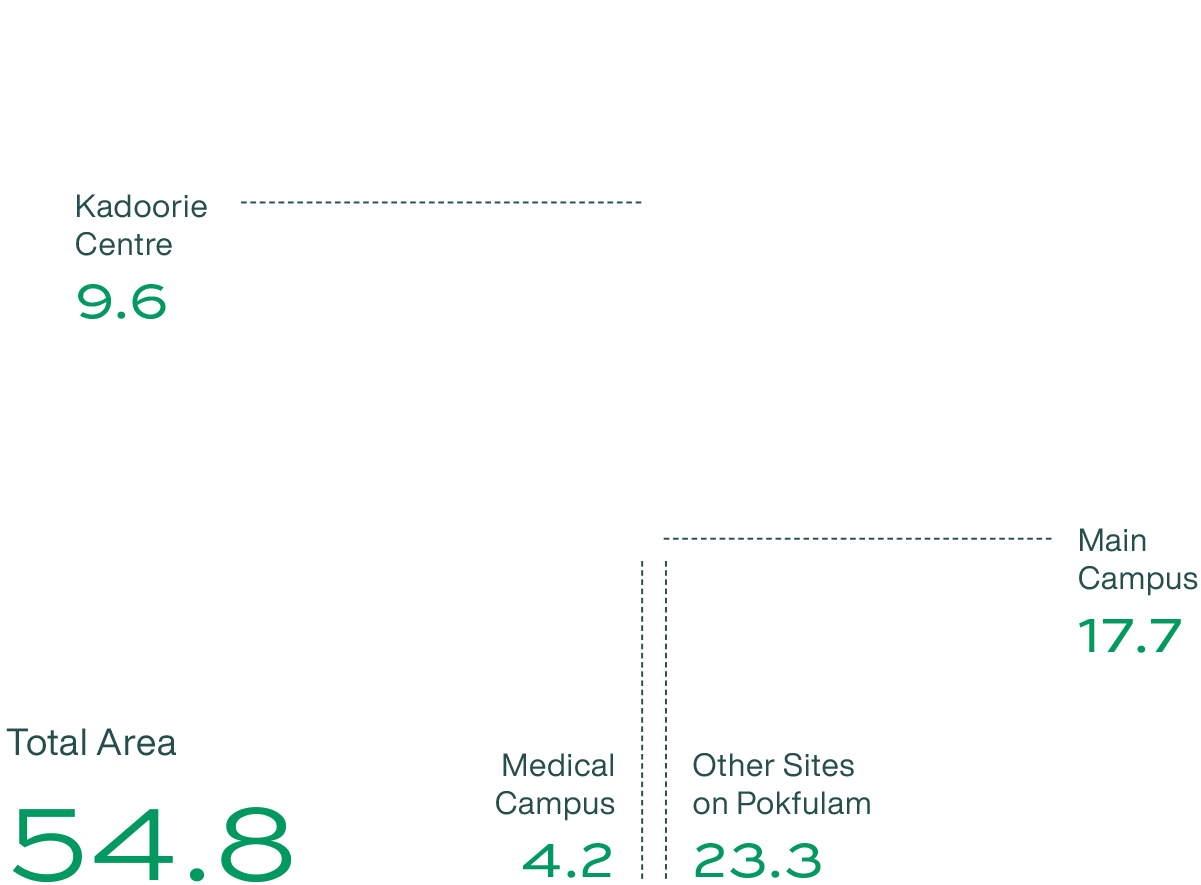
LAND HOLDINGS
As of June 2023
In hectares
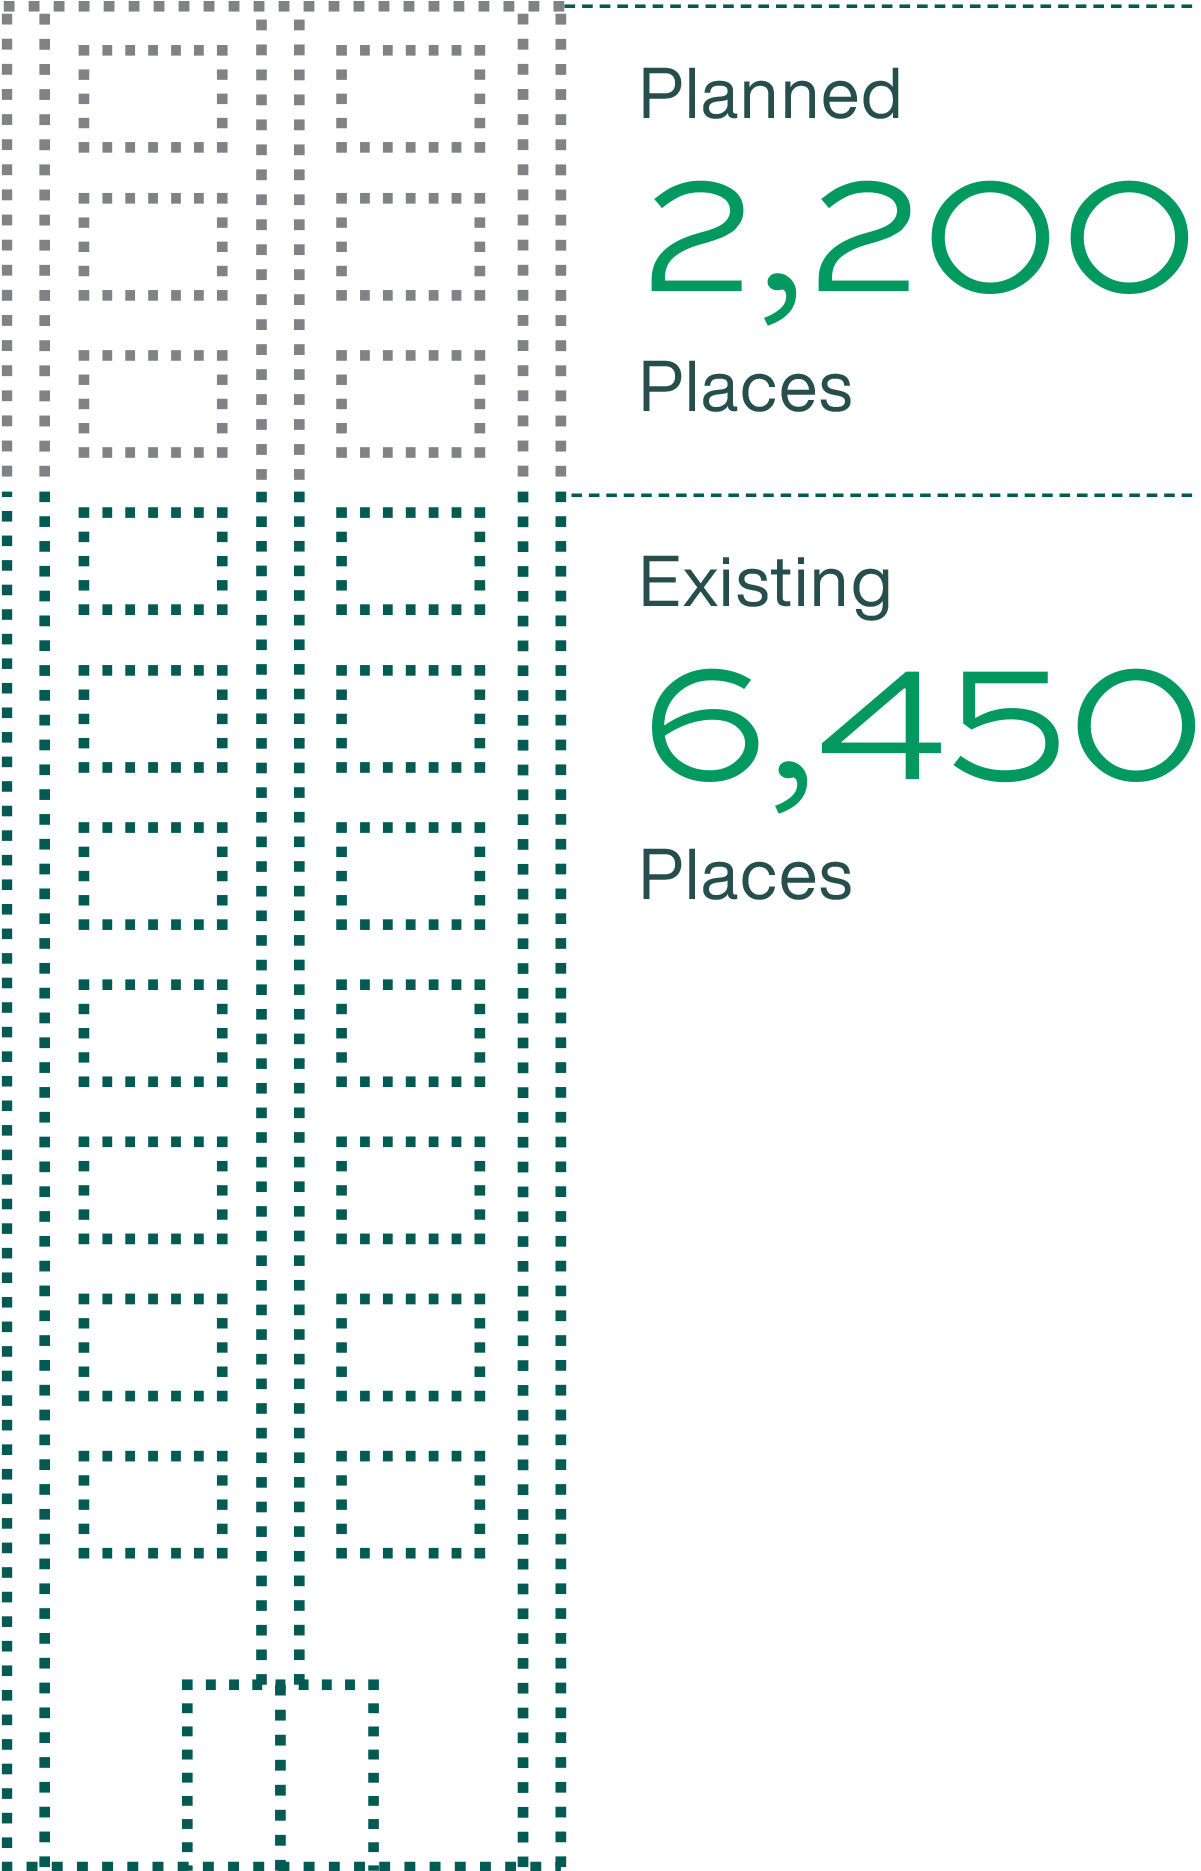
HALLS AND STUDENT RESIDENCES
As of June 2023