
THE UNIVERSITY PROFILE
Some percentages or figures in this section do not add up to 100% or total owing to rounding.
Students*
STUDENT ADMISSION
New intakes
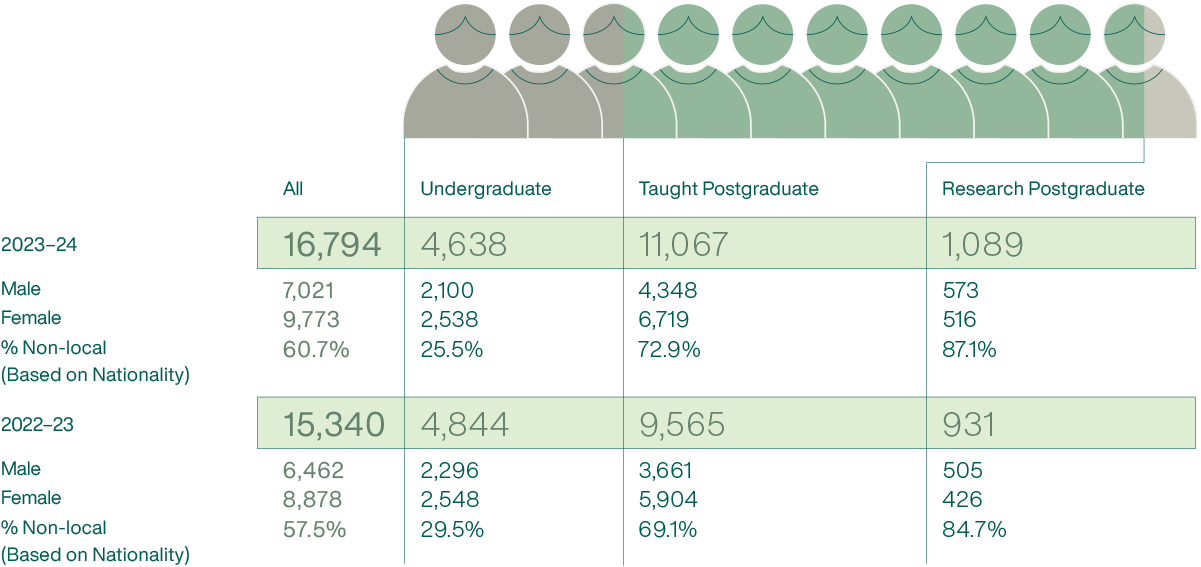
ENROLMENT OF STUDENTS ON ALL PROGRAMMES
| Faculty | Undergraduate | Taught Postgraduate | Research Postgraduate | All Levels | ||||
|---|---|---|---|---|---|---|---|---|
| 2023–24 | 2022–23 | 2023–24 | 2022–23 | 2023–24 | 2022–23 | 2023–24 | 2022–23 | |
| Architecture | 745 | 730 | 863 | 768 | 179 | 163 | 1,787 | 1,661 |
| Arts | 1,942 | 1,871 | 1,474 | 1,076 | 188 | 225 | 3,604 | 3,172 |
| Business and Economics | 3,189 | 3,076 | 5,264 | 4,562 | 194 | 179 | 8,647 | 7,817 |
| Dentistry | 486 | 466 | 92 | 83 | 157 | 120 | 735 | 669 |
| Education | 909 | 939 | 1,453 | 1,413 | 237 | 248 | 2,599 | 2,600 |
| Engineering | 2,620 | 2,558 | 2,721 | 2,405 | 1,057 | 933 | 6,398 | 5,896 |
| Law | 581 | 569 | 1,215 | 1,145 | 95 | 96 | 1,891 | 1,810 |
| Medicine | 3,534 | 3,485 | 1,037 | 937 | 996 | 908 | 5,567 | 5,330 |
| Science | 2,764 | 2,626 | 840 | 708 | 721 | 684 | 4,325 | 4,018 |
| Social Sciences | 1,721 | 1,708 | 1,582 | 1,445 | 269 | 261 | 3,572 | 3,414 |
| Non-faculty-based | 0 | 0 | 0 | 0 | 41 | 0 | 41 | 0 |
| All Faculties | 18,491 | 18,028 | 16,541 | 14,542 | 4,134 | 3,817 | 39,166 | 36,387 |
| In % Distribution | 47.2% | 49.5% | 42.2% | 40.0% | 10.6% | 10.5% | 100% | 100% |
*All student statistics shown above include students on UGC-funded, self-funded as well as outreach programmes. Exchange-in and visiting students are excluded.
ENROLMENT OF NON-LOCAL STUDENTS (BASED ON NATIONALITY)
| Region | Undergraduate | Taught Postgraduate | Research Postgraduate | All Levels | ||||
|---|---|---|---|---|---|---|---|---|
| 2023–24 | 2022–23 | 2023–24 | 2022–23 | 2023–24 | 2022–23 | 2023–24 | 2022–23 | |
| Headcount | ||||||||
| Mainland China | 3,180 | 2,887 | 9,849 | 7,769 | 3,115 | 2,749 | 16,144 | 13,405 |
| Other Asian Countries | 1,416 | 1,522 | 380 | 316 | 194 | 212 | 1,990 | 2,050 |
| Australia and New Zealand | 73 | 64 | 41 | 61 | 11 | 14 | 125 | 139 |
| European Countries | 166 | 207 | 162 | 189 | 80 | 88 | 408 | 484 |
| North American Countries | 138 | 134 | 156 | 158 | 49 | 54 | 343 | 346 |
|
Others e.g. Central and South America, African Countries |
40 | 30 | 67 | 39 | 28 | 32 | 135 | 101 |
| All Regions | 5,013 | 4,844 | 10,655 | 8,532 | 3,477 | 3,149 | 19,145 | 16,525 |
| % | ||||||||
| Mainland China | 63.4% | 59.6% | 92.4% | 91.1% | 89.6% | 87.3% | 84.3% | 81.1% |
| Other Asian Countries | 28.2% | 31.4% | 3.6% | 3.7% | 5.6% | 6.7% | 10.4% | 12.4% |
| Australia and New Zealand | 1.5% | 1.3% | 0.4% | 0.7% | 0.3% | 0.4% | 0.7% | 0.8% |
| European Countries | 3.3% | 4.3% | 1.5% | 2.2% | 2.3% | 2.8% | 2.1% | 2.9% |
| North American Countries | 2.8% | 2.8% | 1.5% | 1.9% | 1.4% | 1.7% | 1.8% | 2.1% |
|
Others e.g. Central and South America, African Countries |
0.8% | 0.6% | 0.6% | 0.5% | 0.8% | 1.0% | 0.7% | 0.6% |
| All Regions | 100% | 100% | 100% | 100% | 100% | 100% | 100% | 100% |
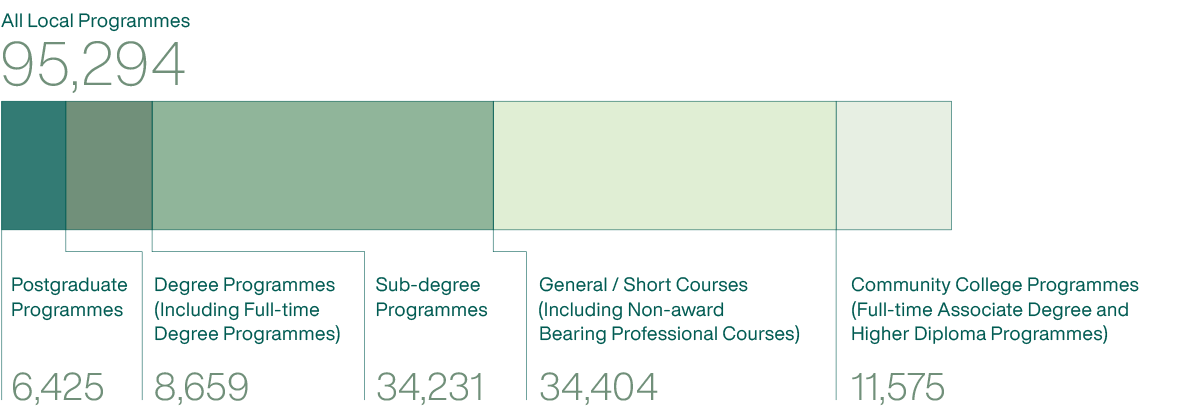
HKU SCHOOL OF PROFESSIONAL AND CONTINUING EDUCATION (HKU SPACE)
ENROLMENT OF STUDENTS IN PROGRAMMES RUN BY HKU SPACE IN 2023–24
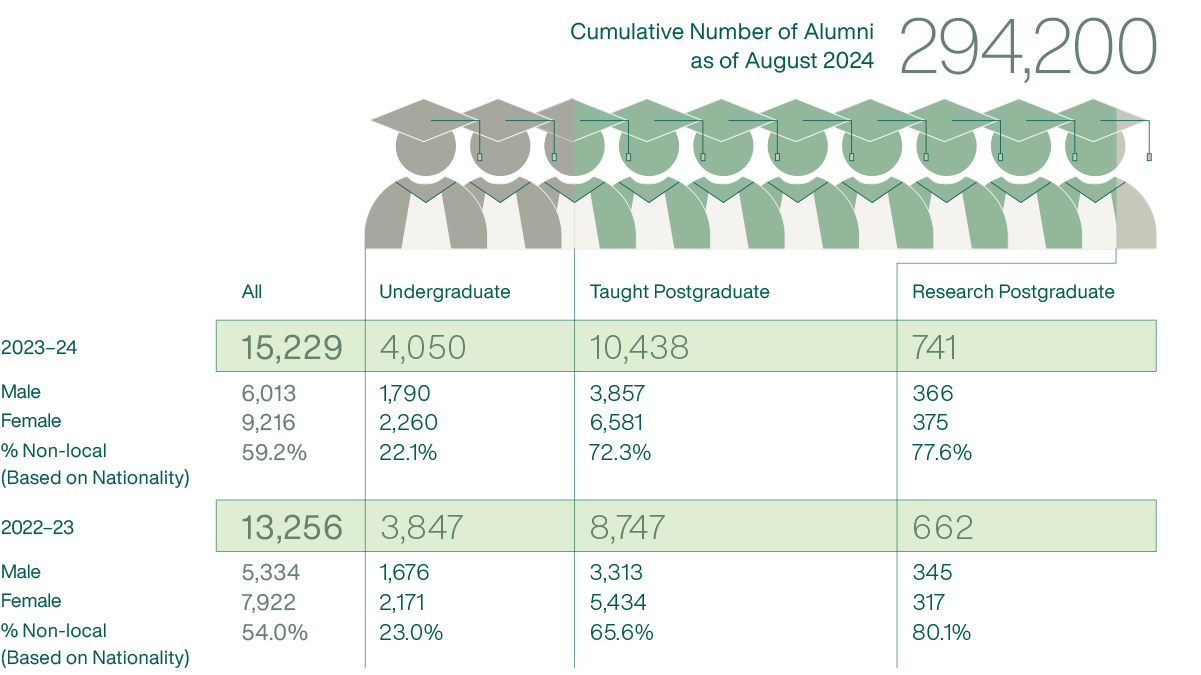
GRADUATES*
GRADUATES OF ALL PROGRAMMES
DISTRIBUTION OF NON-LOCAL GRADUATES (BASED ON NATIONALITY)
| Region | Undergraduate | Taught Postgraduate | Research Postgraduate | All Levels | ||||
|---|---|---|---|---|---|---|---|---|
| 2023–24 | 2022–23 | 2023–24 | 2022–23 | 2023–24 | 2022–23 | 2023–24 | 2022–23 | |
| Headcount | ||||||||
| Mainland China | 478 | 422 | 7,132 | 5,318 | 496 | 453 | 8,106 | 6,193 |
| Other Asian Countries | 328 | 356 | 213 | 189 | 44 | 37 | 585 | 582 |
| Australia and New Zealand | 16 | 12 | 26 | 39 | 2 | 3 | 44 | 54 |
| European Countries | 35 | 65 | 90 | 107 | 16 | 20 | 141 | 192 |
| North American Countries | 31 | 29 | 82 | 78 | 13 | 9 | 126 | 116 |
|
Others e.g. Central and South America, African Countries |
8 | 1 | 6 | 9 | 4 | 8 | 18 | 18 |
| All Regions | 896 | 885 | 7,549 | 5,740 | 575 | 530 | 9,020 | 7,155 |
| % | ||||||||
| Mainland China | 53.3% | 47.7% | 94.5% | 92.6% | 86.3% | 85.5% | 89.9% | 86.6% |
| Other Asian Countries | 36.6% | 40.2% | 2.8% | 3.3% | 7.7% | 7.0% | 6.5% | 8.1% |
| Australia and New Zealand | 1.8% | 1.4% | 0.3% | 0.7% | 0.3% | 0.6% | 0.5% | 0.8% |
| European Countries | 3.9% | 7.3% | 1.2% | 1.9% | 2.8% | 3.8% | 1.6% | 2.7% |
| North American Countries | 3.5% | 3.3% | 1.1% | 1.4% | 2.3% | 1.7% | 1.4% | 1.6% |
|
Others e.g. Central and South America, African Countries |
0.9% | 0.1% | 0.1% | 0.2% | 0.7% | 1.5% | 0.2% | 0.3% |
| All Regions | 100% | 100% | 100% | 100% | 100% | 100% | 100% | 100% |
* All graduate statistics shown above include graduates on UGC-funded, self-funded as well as outreach programmes.
NUMBER OF PROGRAMMES#
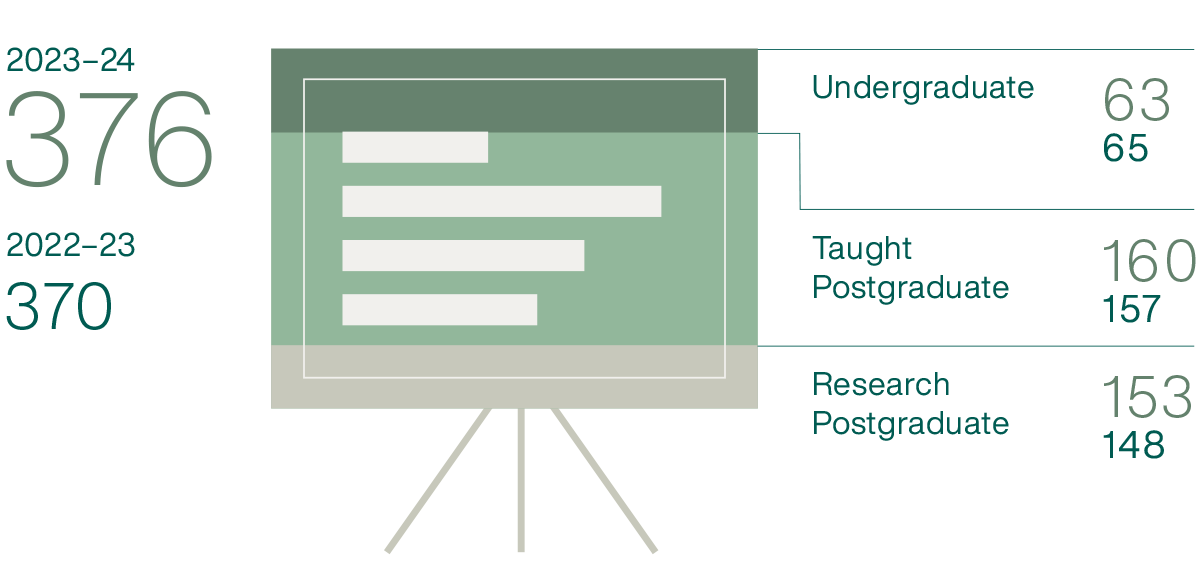
# The number of programmes listed include where applicable, programmes offered in the full-time and part-time modes which are counted as separate programmes. The counting of research postgraduate programmes is based on the academic departments with research postgraduate students enrolled in the year under reference.
STAFF+
NUMBER OF STAFF IN HEADCOUNT
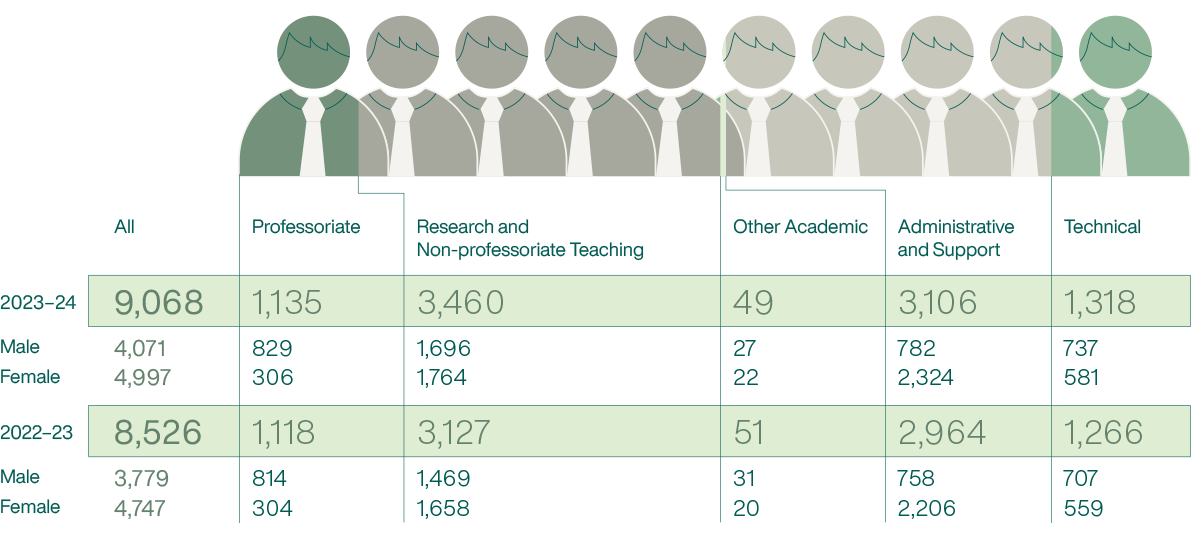
DISTRIBUTION OF NON-LOCAL PROFESSORIATE STAFF (BASED ON NATIONALITY)

+ All staff statistics shown above include UGC-funded and self-funded staff, honorary and visiting staff are excluded.
RESEARCH
RESEARCH FUNDING
HK$ (in million)
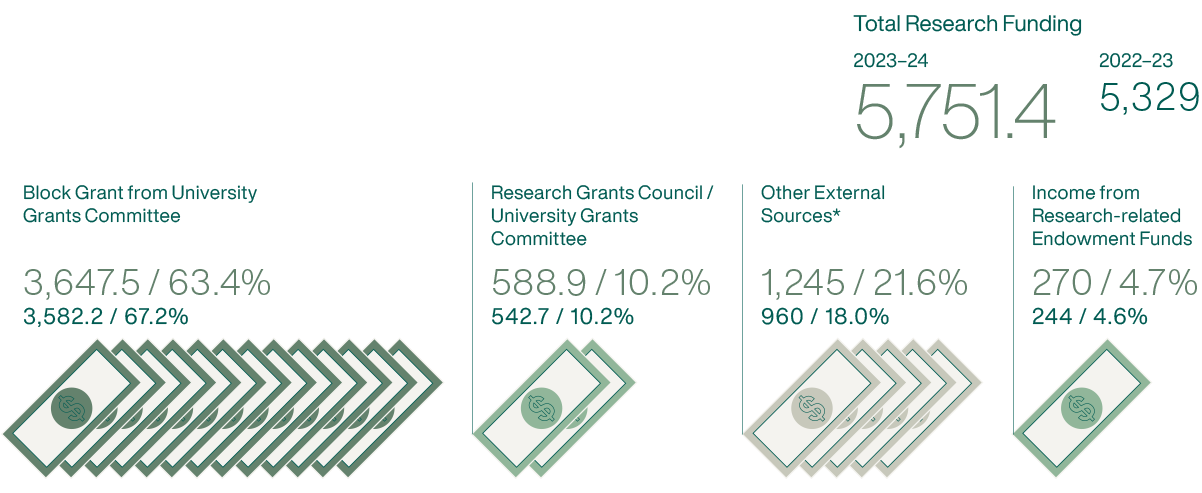
* Includes the following fund sources: government, private, industry and HKU Foundation.
RESEARCH PROJECTS
Ongoing and new
| Broad Disciplinary Area | Research Grants Projects | Research Contract Projects | All | ||||
|---|---|---|---|---|---|---|---|
| No. of Projects | HK$ M | No. of Projects | HK$ M | No. of Projects | HK$ M | ||
| Biology and Medicine |
2023–24 2022–23 |
4,548 4,488 |
9,197.8 8,750.4 |
429 423 |
1,090.7 1,020.9 |
4,978 4,911 |
10,288.5 9,771.2 |
| Engineering |
2023–24 2022–23 |
1,058 956 |
1,700.6 1,470.1 |
178 186 |
281.7 282 |
1,236 1,142 |
1,982.3 1,752.1 |
| Humanities, Social Sciences and Business Studies |
2023–24 2022–23 |
1,739 1,704 |
2,396.7 2,355.5 |
130 167 |
235.9 281.4 |
1,869 1,871 |
2,632.6 2,636.9 |
| Physical Sciences |
2023–24 2022–23 |
729 689 |
1,063.2 959.6 |
39 43 |
85.6 94.6 |
768 732 |
1,148.8 1,054.2 |
| All Disciplines |
2023–24 2022–23 |
8,075 7,837 |
14,358.3 13,535.6 |
775 819 |
1,693.9 1,678.9 |
8,850 8,656 |
16,052.2 15,214.5 |
CUMULATIVE NUMBER OF PATENTS GRANTED
Since 1998 and up to June 2024
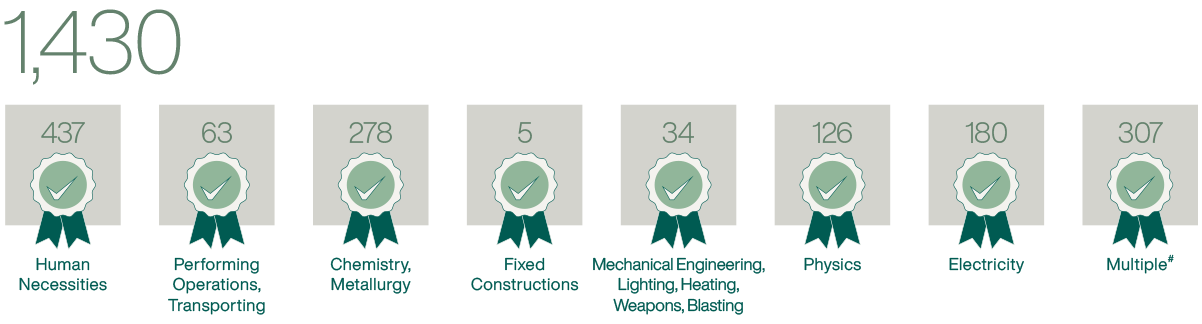
# ‘Multiple’ refers to patents granted which cover more than one of the types specified.
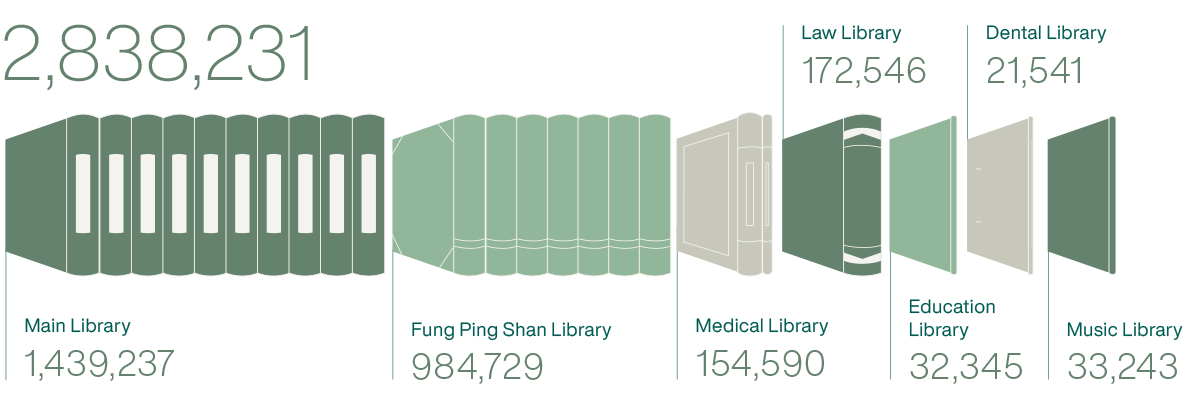
LIBRARY RESOURCES
NUMBER OF BOUND VOLUMES IN MAIN AND SPECIALIST LIBRARIES 2023–24
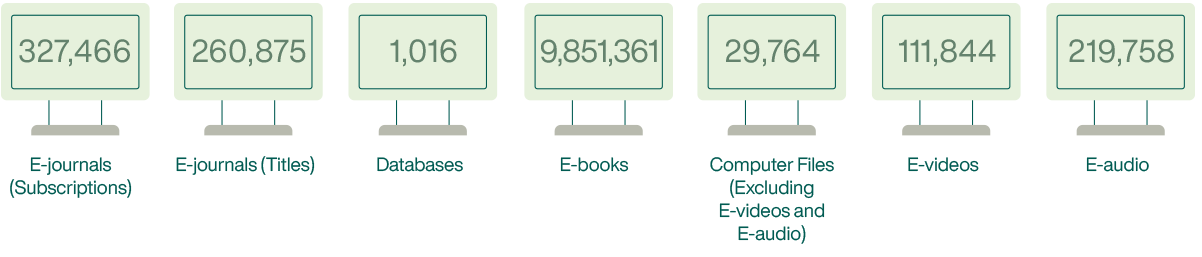
E-RESOURCES 2023–24
TOTAL NUMBER OF REGISTERED LIBRARY USERS 2023–24

145,888
STUDENT LEARNING SUPPORT RESOURCES / SERVICES 2023–24

Total Library
Seats
3,136

Group Discussion
Rooms
53

24 Hours Library
Seats for All
88

Computer
Workstations
412

Wireless Network
Access Points
211

Postgraduate
Library Workshops
71

Single Study Carrels /
Rooms for
Postgraduate
Students
Main Library
60
Law Library
38
Medical Library
30

Information and
Referral Service
51,724
Reference Transactions
COMPUTING AND NETWORK RESOURCES
COMPUTING AND NETWORK RESOURCES
As of June 2024

Wired Network
Access Points
50,132

Wireless Network
Access Points
13,524

Total Bandwidth for Direct Connection to the Internet and Research / Education Networks
42
Gbps

Aggregated Central Computing Power for Teaching and Research Purposes (Theoretical Peak Computing Speed)
1,070.2
TFLOPS
GIVING TO HKU
DONATION FACTS 2023–24
Total Number
of Gifts Received
3,987
Total Amount
of Donations (HK$)
1,108M
Total Number
of Donors
2,815
Number of First-time
Donors
1,916
Ratio of Alumni vs Non-alumni Donors
73:27
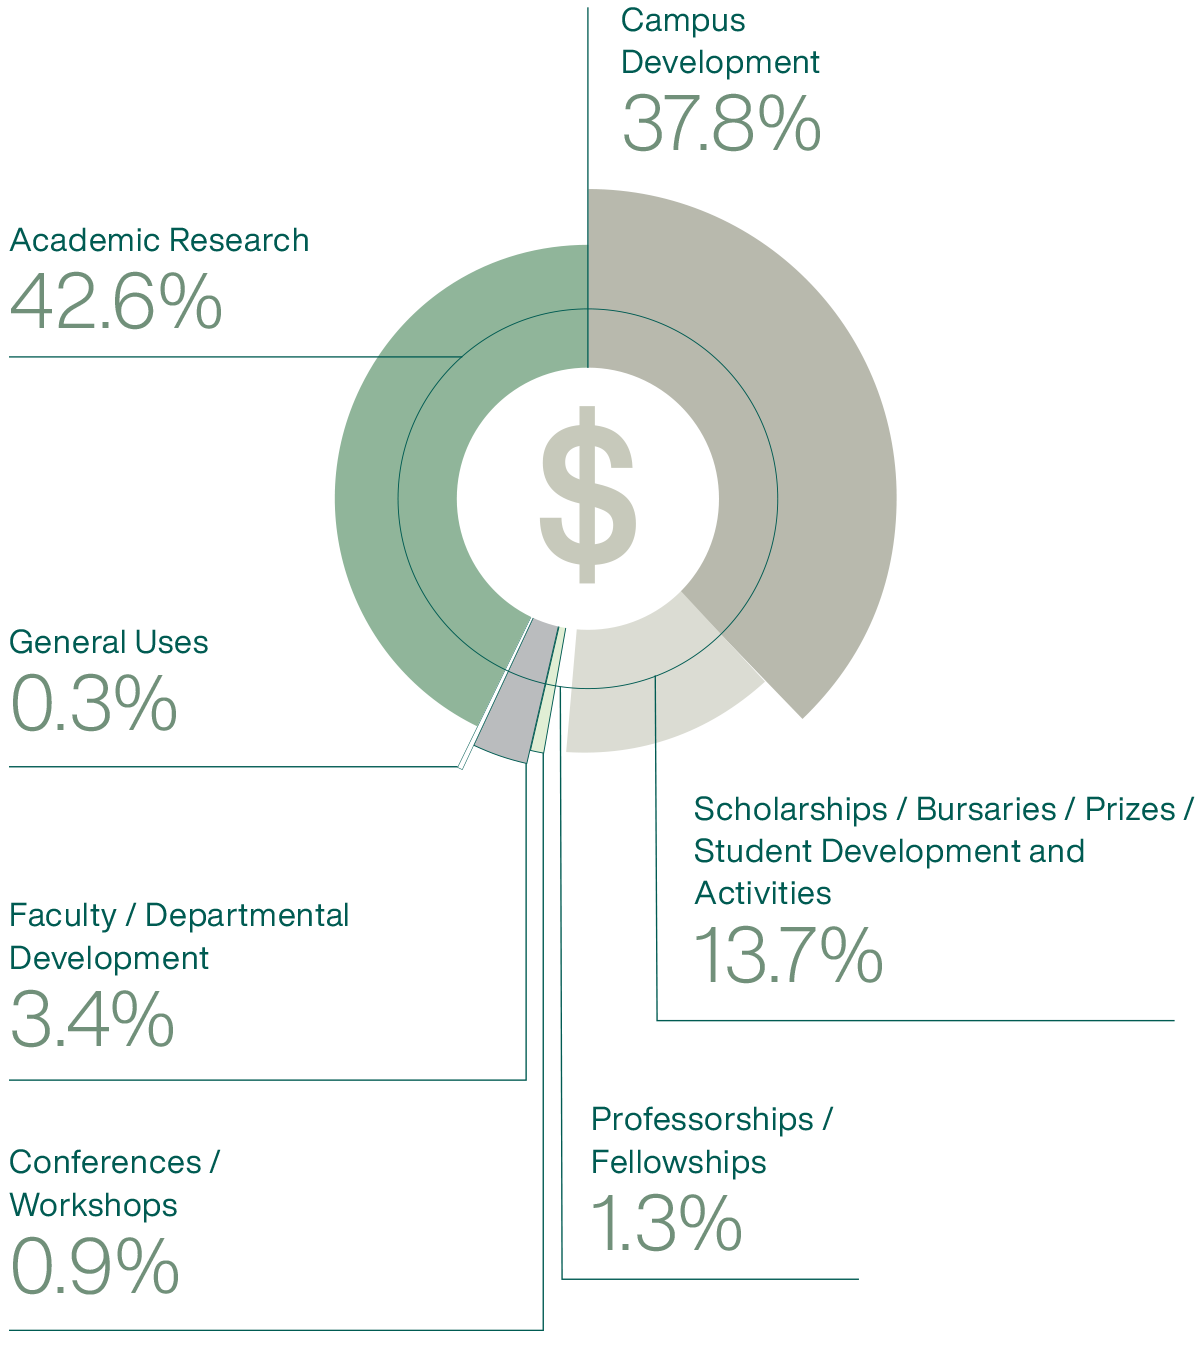
DISTRIBUTION OF DONATIONS 2023–24
FINANCE
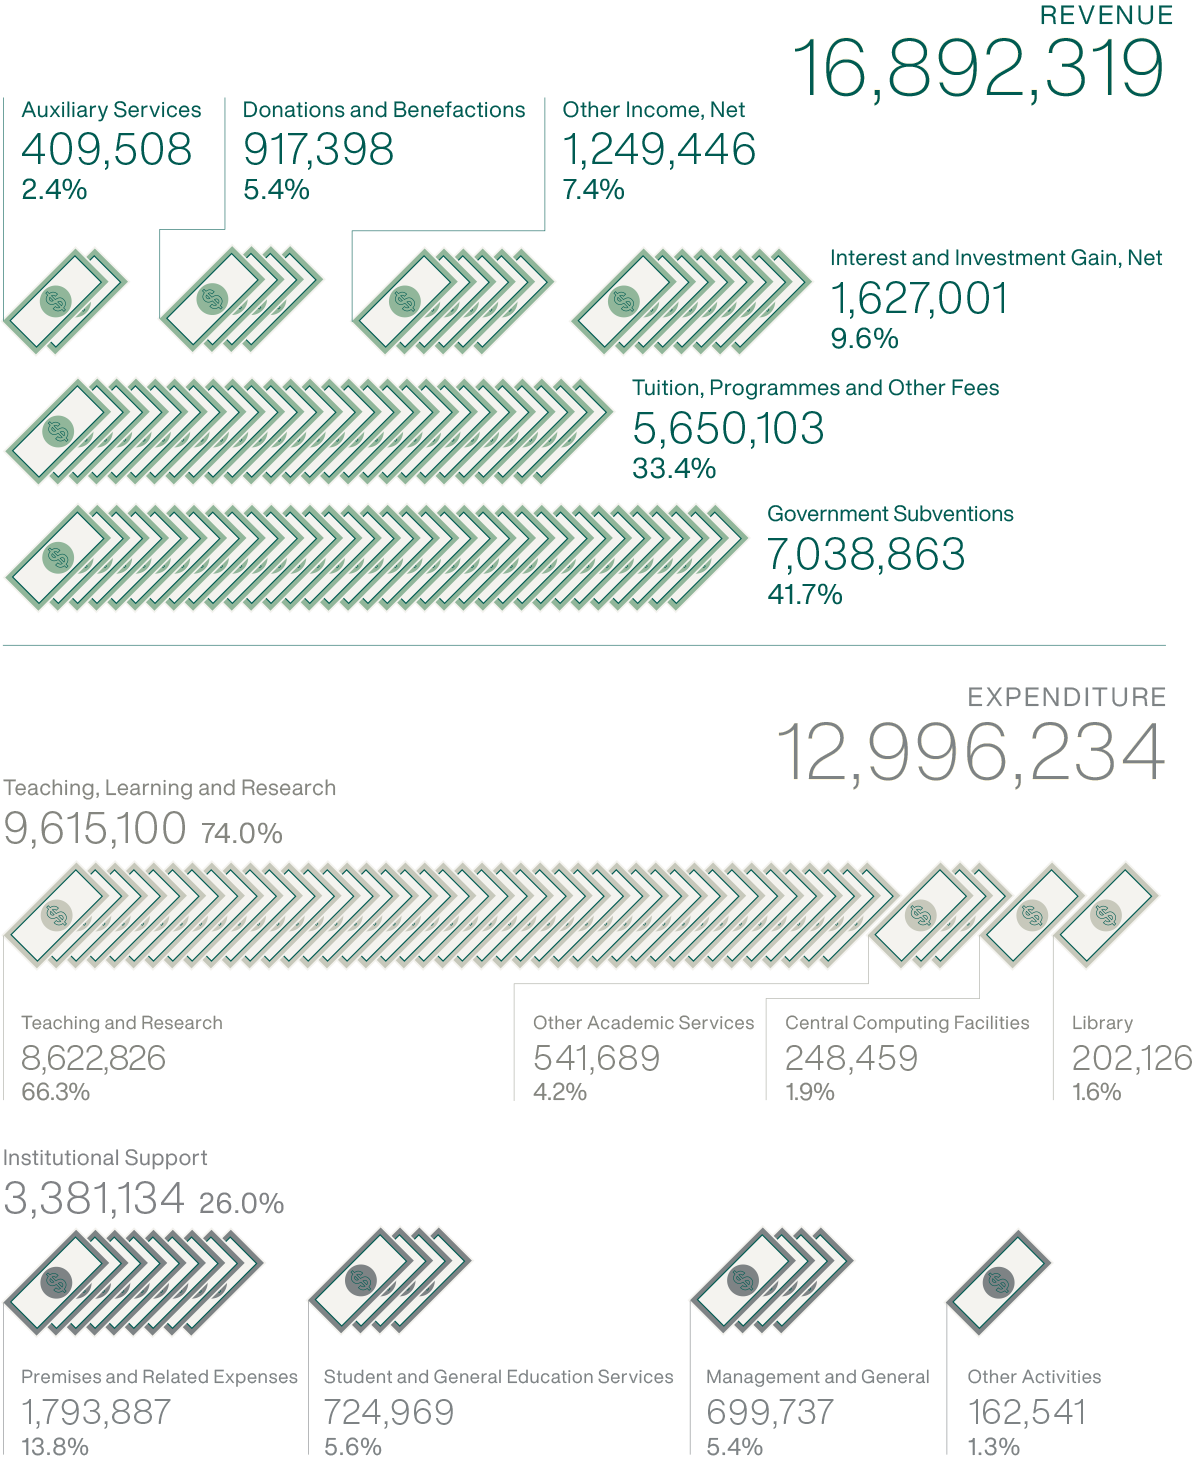
AN ANALYSIS OF CONSOLIDATED INCOME AND EXPENDITURE
For the year ended June 30, 2024
In thousands of Hong Kong
dollars
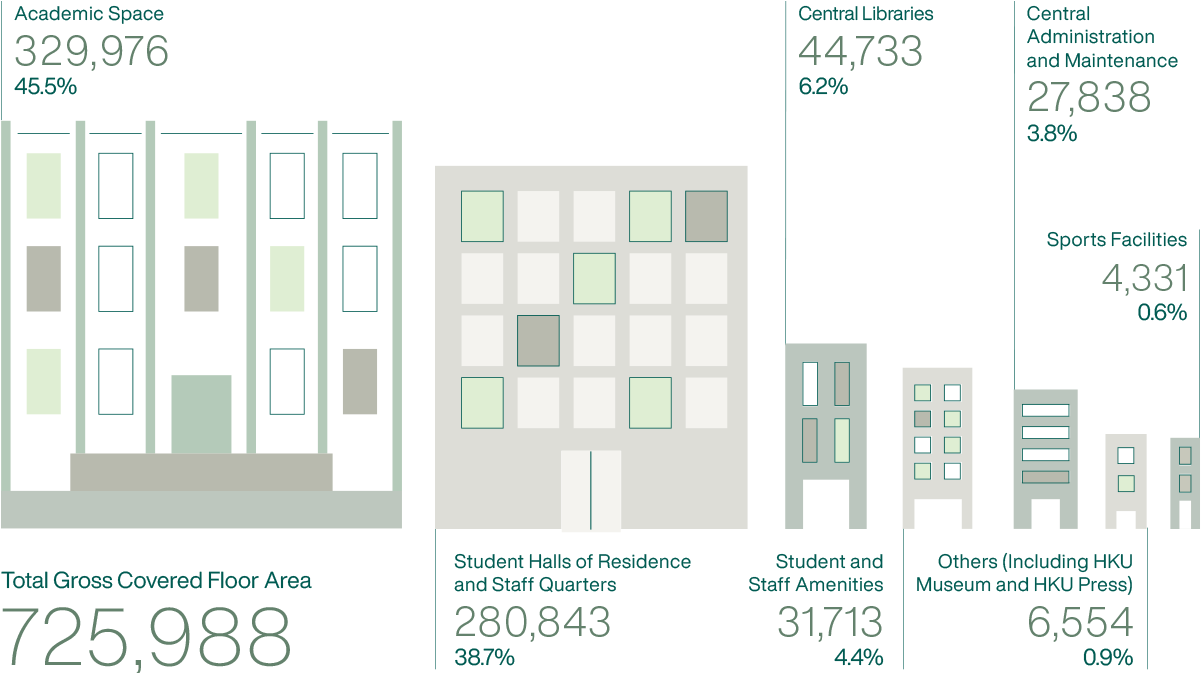
SPACE
DISTRIBUTION OF SPACE BY CATEGORIES BASED ON TOTAL GROSS COVERED FLOOR AREA
As of June 2024
In sq.m.
HKU SPACE GROSS COVERED FLOOR AREA
As of June 2024
45,577 sq.m.
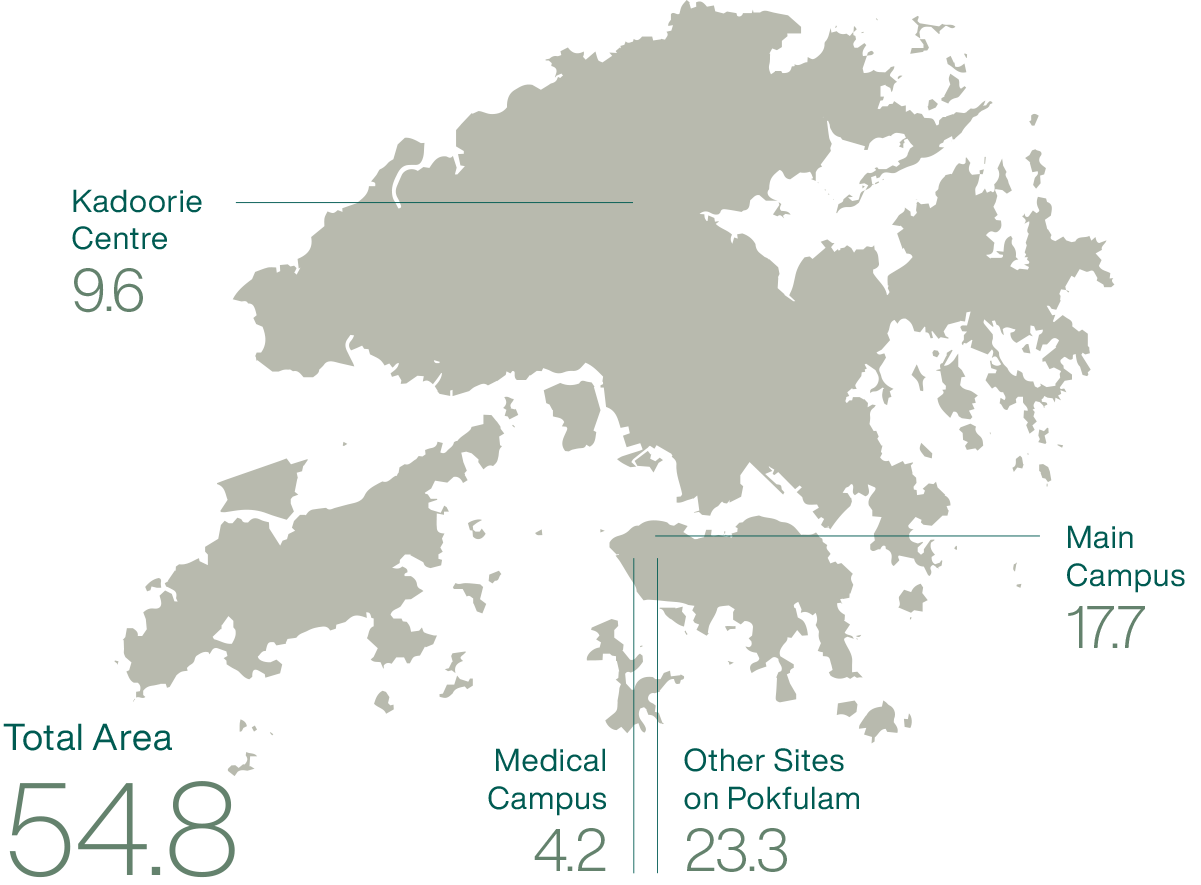
LAND HOLDINGS
As of June 2024
In hectares
HALLS AND STUDENT RESIDENCES
As of June 2024
